Every Boarding. Every Alighting.
Every Train. Counted.
Why accurate, continuous automatic passenger counting at every platform is the foundation of smarter commuter rail operations — and how modern APC technology delivers it across entire networks.
Every commuter rail system runs on assumptions. The timetable assumes passenger demand follows predictable patterns. Train length decisions assume load factors are understood. Platform safety procedures assume crowd behaviour is manageable. Infrastructure investment decisions assume the data supporting them is accurate. When those assumptions are correct, the system works. When they aren’t, the consequences range from daily inconvenience to serious safety risk.
The foundation underneath every one of these assumptions is the same: reliable, continuous data showing how many passengers are boarding and alighting at every station, on every train, throughout the operating day. Not estimates from ticket sales. Not periodic manual surveys conducted twice a year. Not extrapolations from partial counts at a handful of representative stations. Actual counts — accurate, automated, and available in real time — from every door of every train at every platform stop.
For most commuter rail agencies, this data has historically been difficult and expensive to collect at scale. Manual counting is labour-intensive, statistically unreliable, and produces snapshots rather than trends. Ticket validation data captures transactions but not passenger behaviour — it cannot distinguish between a passenger who boards and stays for five stops and one who boards and alights at the next station. The result is that critical operational decisions are made on data that is either too coarse, too infrequent, or too indirect to support them properly.
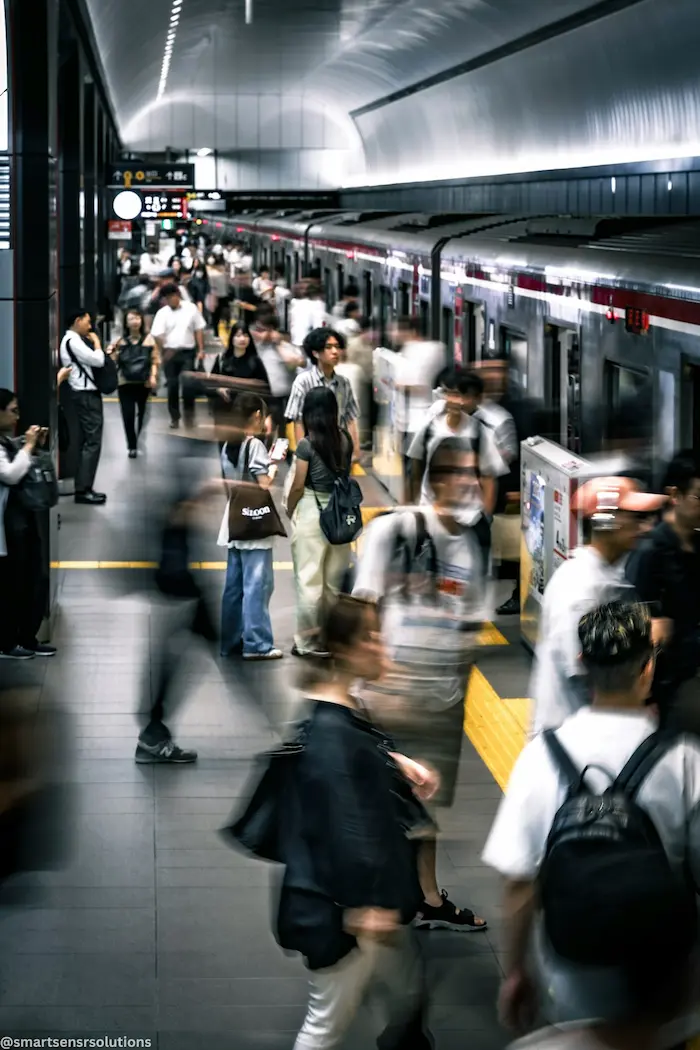
Every boarding and alighting event at every platform is an operational data point — continuous APC makes that data accessible
Commuter rail decisions — about capacity, schedules, safety, infrastructure, and funding — rest on ridership data. When that data is infrequent, estimated, or unreliable, every decision built on it carries compounded uncertainty. Accurate automatic passenger counting eliminates that uncertainty at the source.
Why Current Passenger Counting Methods Are Not Enough
Most commuter rail agencies use a combination of methods to estimate ridership — each with significant limitations that compound when decisions depend on their combined output.
Ticket Sales & Validation Data
Fare transactions capture the number of trips sold or validated but cannot show where passengers board and alight on multi-stop journeys, how train loads distribute across carriages, or how platform occupancy builds and clears between train arrivals. Season pass holders generate no per-trip data at all. The gap between tickets sold and passengers counted is significant — and it grows with every fare policy change.
Manual Survey Counts
Manual ride-checks — staff members stationed on trains or platforms to count boarding and alighting — are expensive, statistically limited to small sample periods, and introduce observer variability. A two-week manual survey conducted twice a year produces data that is already six months old by the time planning decisions are made based on it. Peak periods, special events, and seasonal fluctuations are captured poorly if at all.
Infra-Red Door Sensors
Many older APC deployments use basic infrared beam-break sensors at train doors. These count interruptions rather than passengers — they cannot distinguish between a single person and two people entering side-by-side, struggle with passengers carrying luggage or strollers, and cannot handle bidirectional flow accurately. Counting accuracy in real-world conditions often falls well short of what planning-grade data requires.
Estimation and Extrapolation
When direct data is unavailable, agencies extrapolate from partial counts, apply expansion factors derived from historical surveys, or use modelling assumptions. These methods can produce reasonable network-level estimates but systematically fail at the station and train level — which is precisely where operational decisions need to be made.
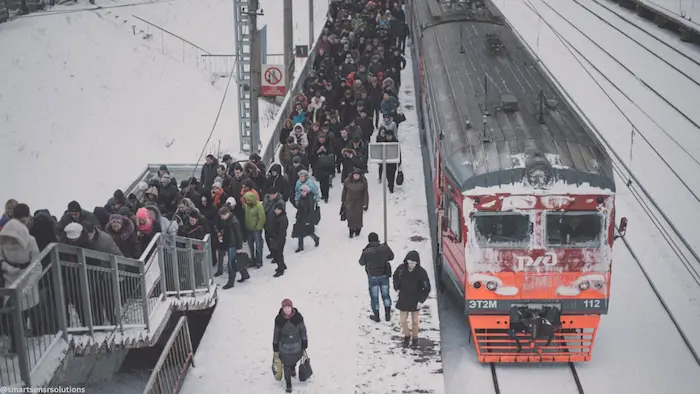
Overcrowding is the most visible symptom of capacity planning based on estimated rather than actual boarding data
Six Decisions That Depend on Accurate Boarding and Alighting Data
Boarding and alighting counts are not a metric for their own sake — they are the input data that makes a wide range of critical rail operations decisions evidence-based rather than assumption-based. Here is where accurate continuous APC data makes the most difference.
Train Capacity and Consist Management
Which trains need additional carriages? Which runs are consistently operating at load factors that compromise comfort and dwell time? Without per-train boarding data, consist decisions are made on schedule pattern assumptions rather than actual demand — resulting in either unnecessary operating costs from over-provisioned trains or chronic overcrowding on under-provisioned ones. Accurate APC data makes consist optimisation a data-driven process rather than an educated guess.
Timetable and Frequency Optimisation
The most valuable timetable insight is not average daily ridership — it is the distribution of demand by time of day, direction, and station. Which specific departure times are saturated while adjacent departures run light? Where would a 15-minute frequency improvement capture significantly more demand than current scheduling allows? Continuous boarding data answers these questions with the precision required to justify timetable changes to funding bodies and operations teams alike.
Platform Safety and Crowd Management
Platform occupancy monitoring is not just an operational convenience — it is a safety function. Real-time passenger counts at platforms enable operators to detect dangerous crowding before it approaches platform edges, manage surge conditions at major stations and transfer points, and provide event and emergency management teams with the situational awareness they need to respond effectively. The dwell time implications of high platform loads also affect punctuality — another area where real-time data enables proactive rather than reactive response.
Infrastructure Investment Prioritisation
Platform extensions, accessibility upgrades, additional stairways, shelter expansions, and station amenity investments all compete for limited capital budgets. Accurate boarding and alighting data by station provides the objective evidence base that transforms “we think Station X is underserved” into “Station X has experienced a 34% increase in peak alightings over the past three years and its platform cannot safely accommodate the current load.” That kind of evidence changes how boards, governments, and funding agencies evaluate investment priorities.
Funding Applications and Regulatory Reporting
Federal and provincial transit funding programs increasingly require documented ridership data as a condition of grant applications and ongoing performance reporting. The National Transit Database in the US and Transport Canada’s reporting requirements both place significant weight on verified passenger counts. Agencies with continuous, auditable APC data are consistently better positioned in competitive grant environments than those relying on estimates and periodic surveys.
Passenger Information and Experience
Real-time boarding data enables platform information displays that show passengers which carriages are less crowded before the train arrives — reducing the door-clustering behaviour that slows dwell times at busy stations. Predicted occupancy information on mobile apps allows passengers to plan their journey around available capacity rather than discovering overcrowding after they have committed to a departure. This kind of real-time intelligence requires continuous APC data flowing to the passenger information system — which periodic manual counts cannot support.
How Modern APC Technology Works — and Why It’s Different
Modern automatic passenger counting systems use 3D stereoscopic sensors installed above each train door — counting boarding and alighting passengers with greater than 98% accuracy, in both directions simultaneously, regardless of crowd density, lighting conditions, or weather.
Unlike traditional infrared beam-break sensors that count interruptions, 3D sensors perceive depth — reconstructing a three-dimensional image of the doorway and tracking each person as a distinct object as they cross the threshold. Groups entering side-by-side are counted individually. Passengers carrying luggage, strollers, or bicycles are handled correctly. Bidirectional flow — passengers boarding while others alight — is accurately resolved rather than producing net zero counts that mask actual activity.
Each sensor connects to an on-board transmitter that aggregates door counts, combines them with GPS position and dwell time data, and transmits them in real time to the cloud. By the time a train departs a platform, its boarding and alighting counts are already available in the operations dashboard — not waiting for an end-of-day data pull or a monthly report consolidation.
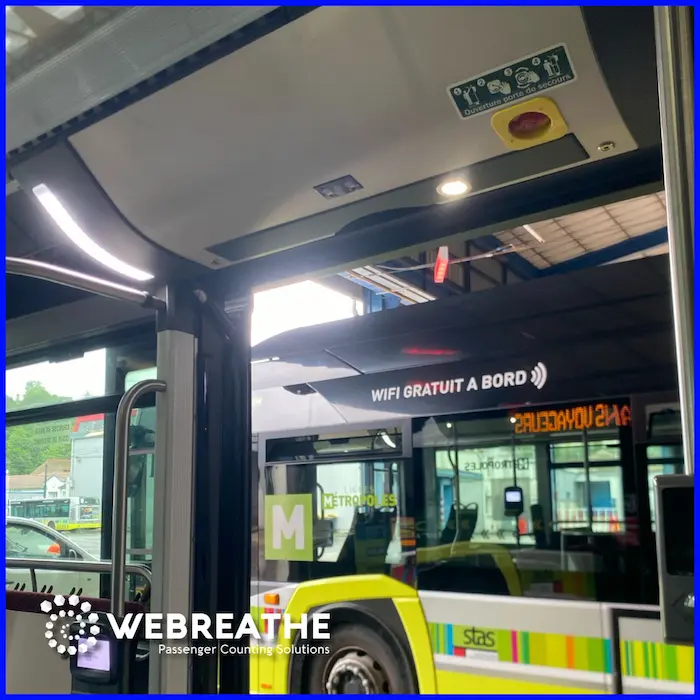
3D APC sensors installed above each door count boarding and alighting simultaneously with greater than 98% accuracy
Modern APC sensors using 3D depth technology do not capture images. They analyse geometry — the shape and movement of objects crossing the doorway — without recording any visual information. No faces, no clothing, no identifying features. Passengers are counted, not identified. GDPR and PIPEDA compliant by design.
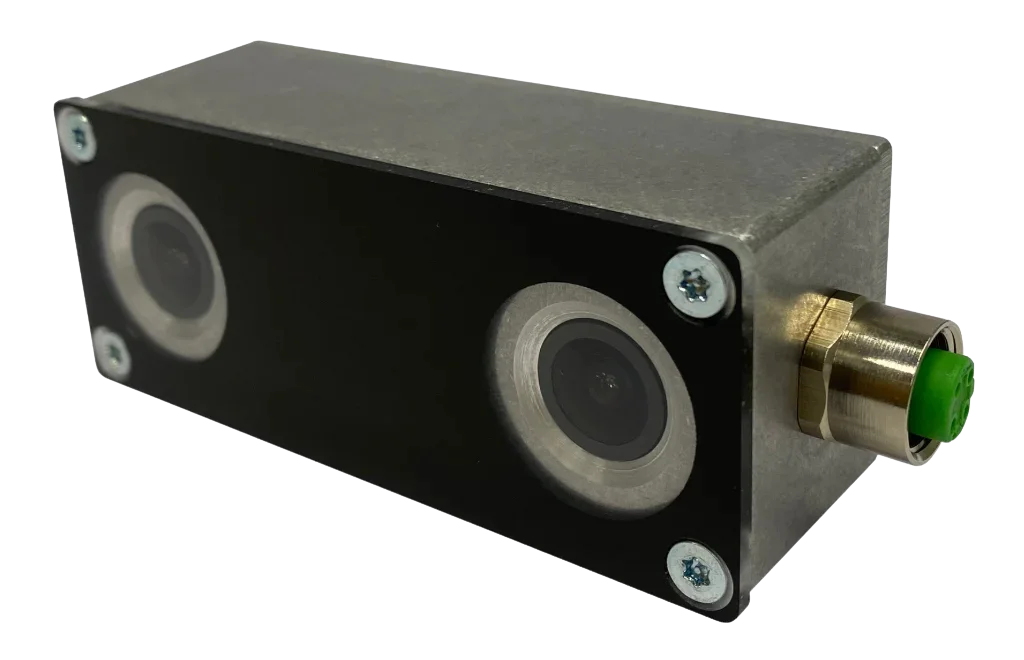
Eyes 3 — The Sensor Behind the Count
The Webreathe Eyes 3 is the world’s smallest transit counting cell — a 3D stereoscopic sensor that mounts above each train or bus door and counts boarding and alighting passengers with greater than 98% accuracy in both directions simultaneously.
Powered by AI with automatic self-optimisation, Eyes 3 distinguishes individual passengers even in dense boarding events, handles bidirectional flow, and is certified to EN50155 railway standards — making it one of the few APC sensors purpose-built for the rigours of rail deployment rather than adapted from a general-purpose counting application.
APC Boarding & Alighting Detection — Live Demo
Watch the Webreathe 2FLOW system counting boarding and alighting passengers in real time.
Real-time boarding and alighting detection using 3D stereoscopic AI counting technology
From Door Sensor to Network Intelligence — The Analytics Layer
Accurate door-level counting data is only valuable if it can be consolidated, visualised, and acted on efficiently. The CARE analytics platform — the cloud-based software layer of the Webreathe 2FLOW system — transforms raw boarding and alighting counts into network-wide operational intelligence accessible from any device.
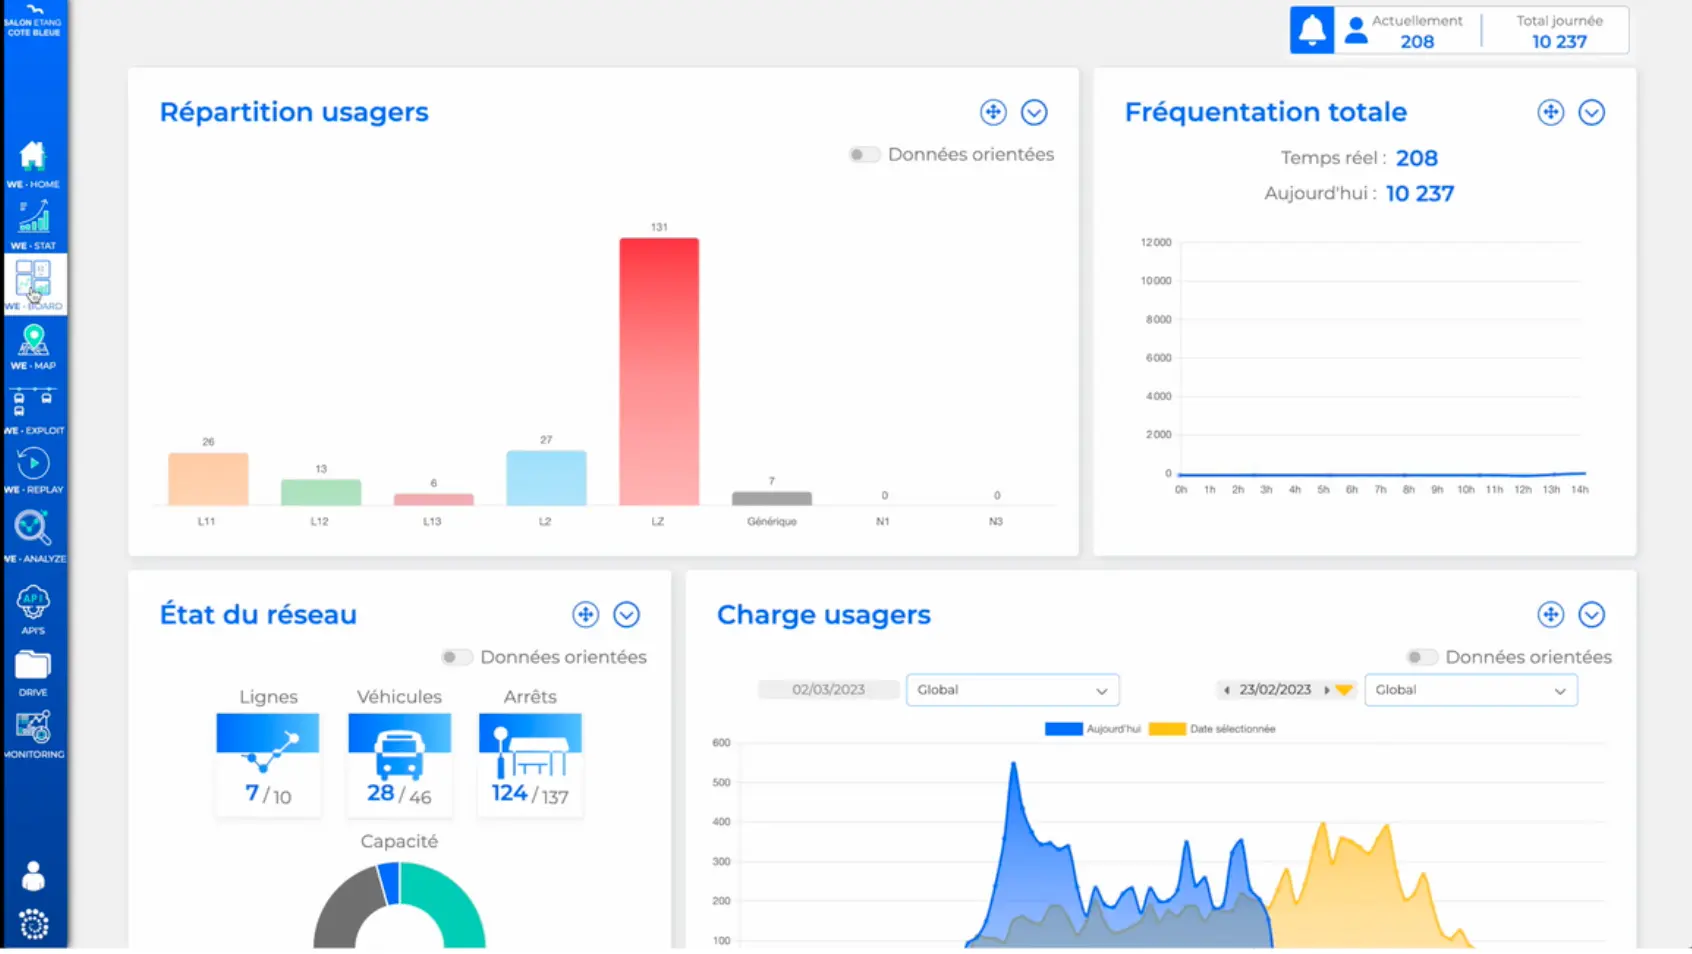
CARE analytics platform — live boarding data, train occupancy, and historical ridership trends across the full network
🗺️ Live Network View
Real-time occupancy by train and station across the entire network. See which trains are approaching capacity and which platforms are building dangerous crowd levels — before the next departure.
📈 Station-Level Trends
Historical boarding and alighting trends by station, direction, and time of day. Identify growth corridors, declining routes, and seasonal patterns that inform timetable and capacity planning.
🚉 Platform Occupancy
Real-time platform crowd levels between train arrivals — enabling proactive safety management and informing passengers before they commit to a particular platform location.
📋 Automated Reporting
Pre-configured reports for NTD submissions, provincial reporting requirements, board presentations, and grant applications — generated automatically from verified APC data without manual data consolidation.
🔔 Overcrowding Alerts
Automatic notifications when train load factors or platform occupancy approach defined thresholds — giving operations teams the lead time to respond before conditions become a safety or service quality issue.
🔌 System Integration
API data feeds to passenger information systems, train management platforms, mobile apps, and operations centres — making boarding data a live input to every downstream system that needs it.
Scalable Across Entire Networks — Not Just Pilot Stations
One of the most common APC deployment patterns is the selective installation — sensors on a subset of trains or at a handful of representative stations, with data from the monitored subset used to estimate conditions across the rest of the network. This approach is understandable given budget constraints, but it has a fundamental limitation: it cannot capture the station-by-station and train-by-train variability that makes the data operationally useful.
A commuter rail network where 30% of trains are equipped produces good statistical estimates for the network as a whole. It does not produce the per-train, per-station data that tells an operations manager which specific departure on a specific route is overcrowded on Tuesday mornings, or that Station D has experienced a 40% increase in peak-hour alightings since a new residential development opened nearby.
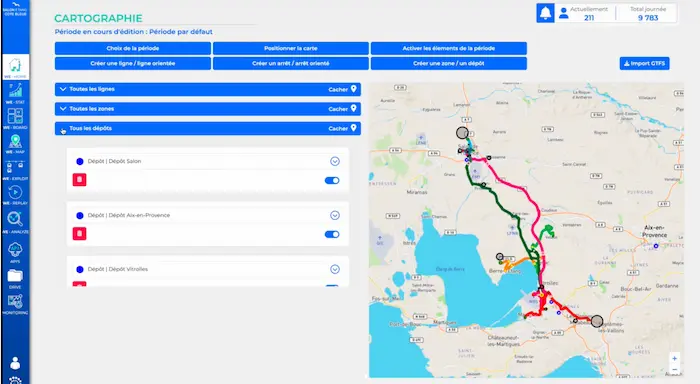
Network-wide APC deployment delivers per-station, per-train data — not estimates from a monitored subset
The Webreathe 2FLOW system is designed for network-wide deployment — with standardised hardware, centralised cloud management, and a monitoring platform that provides visibility across every equipped vehicle from a single interface. Deployment can be phased by fleet type, route priority, or budget cycle without losing the ability to consolidate data across all equipped vehicles in a single analytics view.
Start with a pilot fleet or highest-priority route, validate accuracy against manual counts, and expand to full network coverage on a timeline that aligns with your fleet maintenance schedule and capital budget. Network-wide deployment is the goal — phased deployment is the practical path to get there.
“Boarding and alighting counts are not a metric for their own sake. They are the foundation on which every capacity decision, safety protocol, infrastructure investment, and funding application in modern commuter rail is built.”
— Smart Sensor Solutions
What a Full APC Deployment Delivers
- Door-level boarding and alighting counts — per train, per stop, per direction, continuously and automatically
- Greater than 98% accuracy — verified against manual counts, consistent across crowd densities and door configurations
- Real-time platform occupancy — live crowd levels between train arrivals for safety monitoring and passenger information
- EN50155 railway-certified hardware — purpose-built for rail deployment, not adapted from general-purpose sensors
- Cloud analytics dashboard — network-wide view of boarding data, occupancy trends, and overcrowding alerts from any device
- Automated regulatory reporting — NTD, provincial, and grant application data generated directly from verified APC counts
- Passenger information integration — live occupancy data feeding platform displays and mobile apps
- Privacy compliant — no images, no faces, no personal data captured or retained
- Scalable network deployment — phased fleet rollout with centralised cloud management across all equipped vehicles
- North American integration support — Smart Sensor Solutions provides local project management, installation coordination, and ongoing technical support
Ready to Count Every Boarding and Every Alighting?
Whether you are evaluating APC for the first time, replacing ageing infrared door sensors, or expanding a pilot to full network coverage — we are ready to scope your deployment.
Authorized North American distributor & integrator of Webreathe 2FLOW · Tel: +1 (855) 613 4486 · info@smartsensrsolutions.com